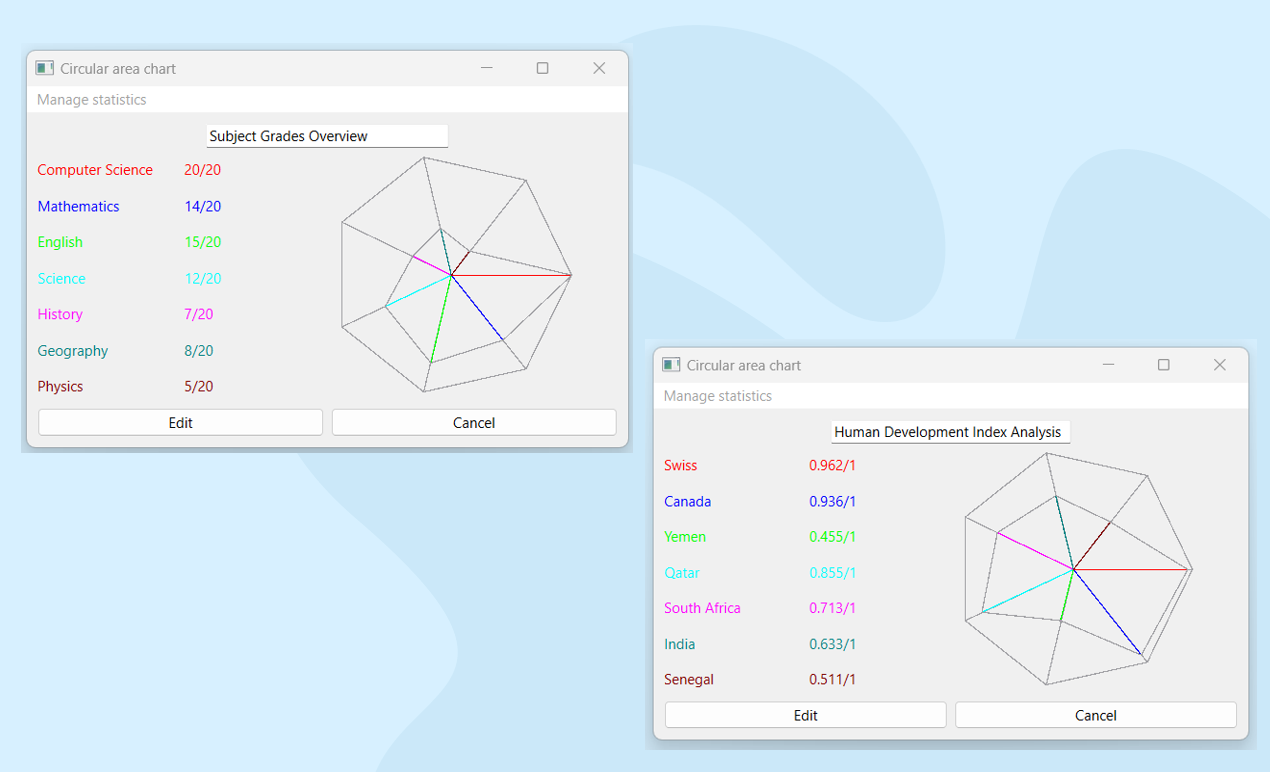
An application developed with the Qt framework that allows users to input statistics and visualize them as pie charts. It provides an intuitive interface for customizing pie charts, making it easy to analyze and understand data proportions and percentages in a clear, visual format.
Source code: https://github.com/YassineIdiri/Laravel_WebChat
📄 Edit menu
You can change the name and value of your variables from the edit menu
⚙️ Add/Deletion menu
Add variables, delete variables, modify the maximum value of variables